Nutmeg is multiplatform, multilingual plotting tool. Primarily, it aims to be light, fast, and responsive, and has been designed to be the go to tool for visualizing and playing with data in the experimental phase of a project.
Notable Features:
- Plotting can be asynchronous with user's program
- Can visualize the updating of data as your program runs
- Fast
- Responsive panning and zooming of data using mouse or multitouch trackpad
- Lay out figure axes and plots using a more intuitive declarative style (QML)
- Makes figure templates easy
- Lay out GUI controls that update parameters, which update the data
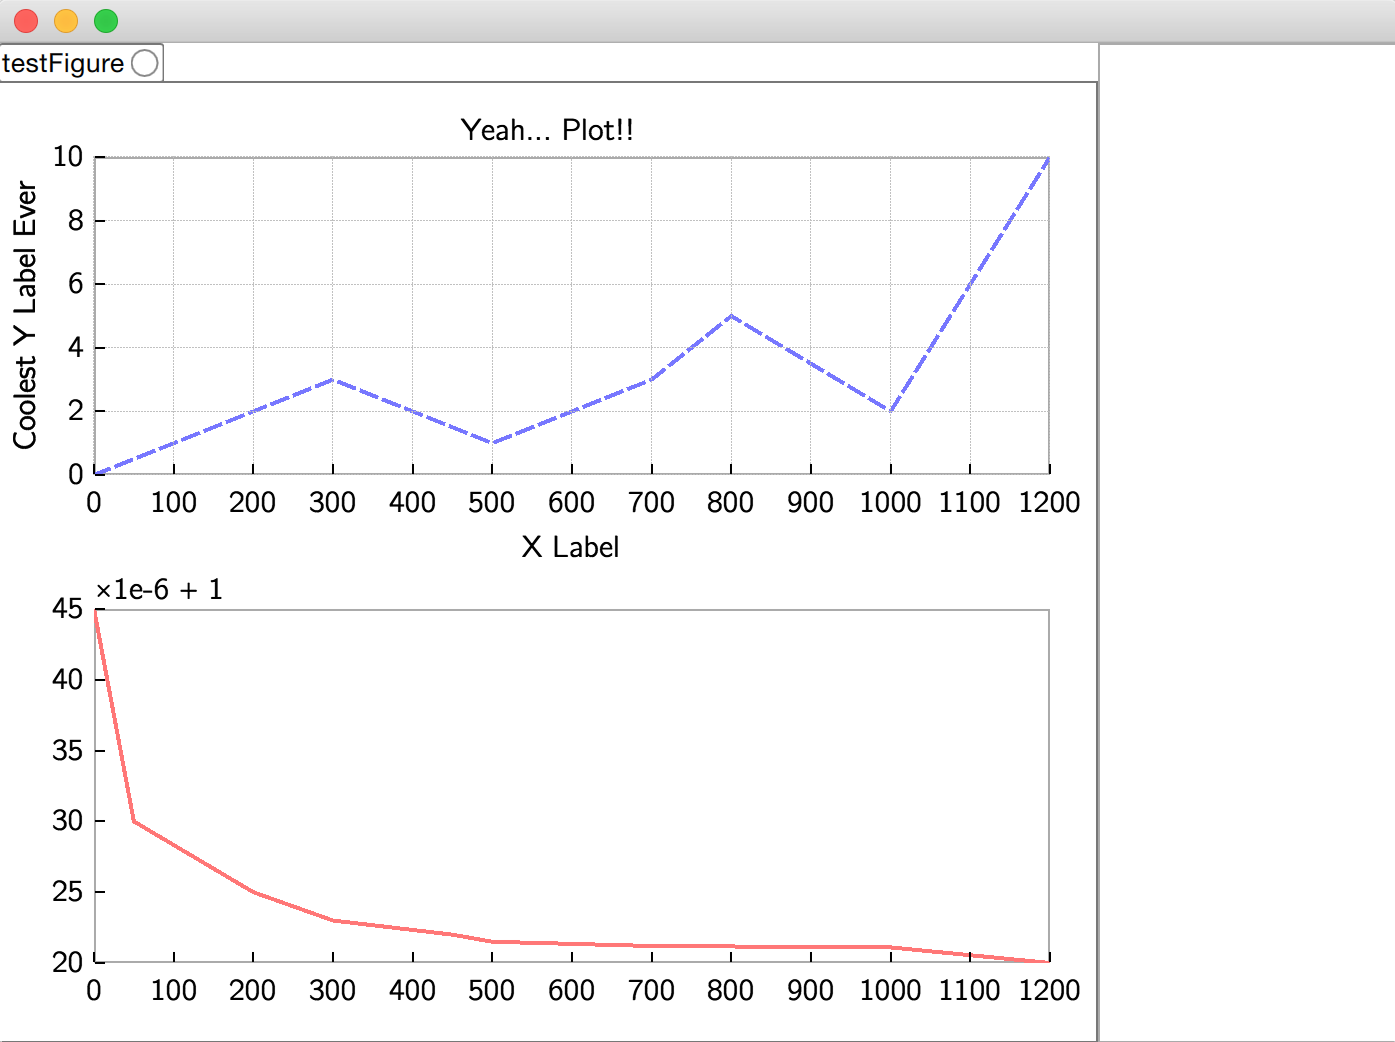
The following QML file declares a Figure which contains two axes. It uses QML style bindings to ensure they take up a certain percentage of the figure space.
figure.qml
import Nutmeg 0.1

Figure {
    id: fig
    Column {
        columnWeights: [0.65, 0.35]

        Axis {
            handle: "axis1"
            LinePlot {
                handle: "data"
                line { color: "#7777FF"; width: 4 }
            }
        }
        Axis {
            handle: "axis2"
            LinePlot {
                handle: "data"
                line { color: "#FF7777"; width: 4 }
            }
        }
    }
}
Using the Python bindings, data can be plotted like so:
import pynutmeg
from numpy import sin, cos, pi, r_

x = r_[0:1:0.01]
y1 = sin(10*pi*x)
y2 = 10*pi*cos(10*pi*x)

fig = pynutmeg.figure("myFigure", "myFigure.qml")

fig.set("axis1.data", x=x, y=y1)
fig.set("axis2.data", x=x, y=y2)
Result:

The Nutmeg core is a stand alone executable, and other programs can draw figures by sending the appropriate data, wrapped up in JSON, via sockets. The socket interface is built on the wonderful ZMQ enabling Nutmeg to support multiple platforms and languages.
The end user could in fact plot using the interface as it is, but a language-side API can simplify the process greatly. Therefore typically a user should become familiar with two interfaces: the QML-style Figure layout, and a language specific Nutmeg library for sending the Figure layout and updating its data.
- Qt 5.6 or higher
- ZMQ 4.x.x (3.2.x should also be fine)
>> git clone https://github.com/kitizz/nutmeg.git
>> cd nutmeg
>> git submodule init
>> git submodule updateBefore building, ensure that in config.pri the include path and library path for
zmq is properly configured. If zmq has
been built with the default configuration in your favourite flavour of Unix, the default
should be fine.
It is recommended to use the MSVC builds of Qt. It is likely you'll need to build ZMQ
yourself. ZMQ 4.1.x is fairly straight forward to build on Windows these days with MSVC.
Modify config.pri accordingly and proceed.
>> cd path/to/nutmeg
>> qmake -r nutmeg.pro
>> make / jom.exe- The GUI must be fast and responsive
- The GUI must never get in the way of the user or make them feel claustrophobic
- View precise information about the displayed data (data points)
- Fast, smooth data updating
- Work on multiple platforms and multiple languages
- Nutmeg core should even run on mobile OSes (Android and iOS)
- Nutmeg clients should run on desktop (Mac, Linux, Windows)
- Replace Matplotlib, GNU Plot, Matlab's plotting
- Output to PDF, etc (for now... with enough popularity, this will probably change)