Mapviz is a ROS based visualization tool with a plug-in system similar to RVIZ focused on visualizing 2D data.

Mapviz currently depends on the marti_common, marti_messages, and lapackpp repositories for some utility functions and message definitions.
Mapviz should be compatible with Ubuntu 12.04 through Ubuntu 14.04 and ROS Fuerte, Groovy, Hydro, and Indigo. The master branch uses the rosbuild make system and the catkin branch uses catkin.
Installing ROS Fuerte, Groovy, Hydro, or Indigo
Additional Ubuntu dependencies beyond ROS base for mapviz:
$ sudo apt-get install ros-XXXX-tf ros-XXXX-common-msgs ros-XXXX-plugin-lib ros-XXXX-gps-umd \
    ros-XXXX-nodelet ros-XXXX-cv-bridge ros-XXXX-image-geometry ros-XXXX-angles \
    ros-XXXX-camera-calibration-parsers ros-XXXX-image-transport

$ sudo apt-get install yaml-cpp libboost-random-dev libblas-dev liblapack-dev libproj-dev \
    libglew-dev freeglut3-dev libxmu-dev libgeos++-dev qt4-dev-tools
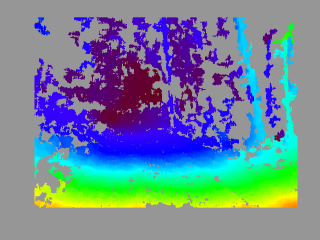
Overlays a sensor_msgs::DisparityImage onto the display using the ''jet'' color map.
Parameters
- Topic: The disparity topic name
- Anchor: (top left | top center | top right | center left | center | center right | bottom left | bottom center | bottom right)
- Offset X: Display offset from the left
- Offset Y: Display offset from the top
- Width: Display width
- Height: Display height
- Units: (pixels | percent of window)
Projects a 2D grid into the scene.
Parameters
- Frame: Coordinate frame of the grid
- Color: Color of the grid
- Alpha: Alpha transparency of the grid
- X: X offset of the grid from the specified coordinate frame origin
- Y: Y offset of the grid from the specified coordinate frame origin
- Size: Size of each grid cell
- Rows: Number of grid rows
- Columns: Number of grid columns
Overlays a sensor_msgs::Image onto the display.
Parameters
- Topic: The image topic name
- Anchor: (top left | top center | top right | center left | center | center right | bottom left | bottom center | bottom right)
- Offset X: Display offset from the left
- Offset Y: Display offset from the top
- Width: Display width
- Height: Display height
- Units: (pixels | percent of window)
Projects a visualization_msgs::Marker or visualization_msgs::MarkerArray into the scene.
Markers are the most flexible display type and more or less mirror the OpenGL primitives.
Parameters
- Topic: The marker topic
Projects a geo-referenced multi-resolution image tile map into the scene. The concept is the same as the Google Maps style pan/zoom satellite imagery.

Parameters
- Geo File: Path to the geo-referenced map tiles.
A custom format is currently used to store the map tiles and geo-reference. The geo-file has the following format:
image_path: "."        # The relative path to the map tiles
image_width: 29184     # The full pixel width of the map
image_height: 15872    # The full pixel height of the map
tile_size: 512         # The pixel size of the individual tiles

datum: "wgs84"         # Datum is currently ignored
projection: "utm"      # (utm|wgs84)

                       # At least 2 tie points are required for
                       # scale, and 3 for orientation.
tiepoints:             #   [pixel x, pixel y, geo x, geo y]
 - point: [4799, 209, 535674.5, 3258382.5]
 - point: [2336, 15596, 535329.5, 3256198.5]
 - point: [26925, 15457, 538837.5, 3256233.5]
 - point: [29133, 84, 539142.5, 3258416.5]
The map tiles are stored in directories for each resolution starting with layer0, the full resolution. In subsequent layers the resolution is halved until the entire map fits within a single tile.
Tiles are named using the following format:
tile%05dx%05d.png % (row, column)
Projects nav_msgs::Odometry message data into the scene.
Parameters
- Topic: The odometry topic
- Color: The color of the odometry data
- Draw Style: (lines | points | arrows)
- Show Covariance: Draw covariance ellipse around latest data
- Position Tolerance: Distance threshold for adding new odometry points to visualization
- Buffer Size: Size of circular buffer of odometry points
Projects nav_msgs::Path message data into the scene.
Parameters
- Topic: The path topic
Projects an image loaded from file into the scene to represent the robot platform.
Parameters
- Image File: Path to the image file
- Frame: Frame to tie the image to
- Width: The physical width represented by the image
- Height: The physical height represented by the image
Projects marti_visualization_msgs::TexturedMarker and marti_visualization_msgs::TexturedMarkerArray message data into the scene.
Textured markers follow the same general approach as traditional markers, but can be used to texture dense image data onto a quad which is projected into the scene.
Parameters
- Topic: The textured marker topic
Projects Tf data into the scene similar to the Odometry plug-in.
Parameters
- Frame: The Tf frame
- Color: The color of the Tf data
- Draw Style: (lines | points | arrows)
- Position Tolerance: Distance threshold for adding new Tf points to visualization
- Buffer Size: Size of circular buffer of Tf points