#Interferometer Watch
Watch a video of Interferometer Watch on YouTube
##About:
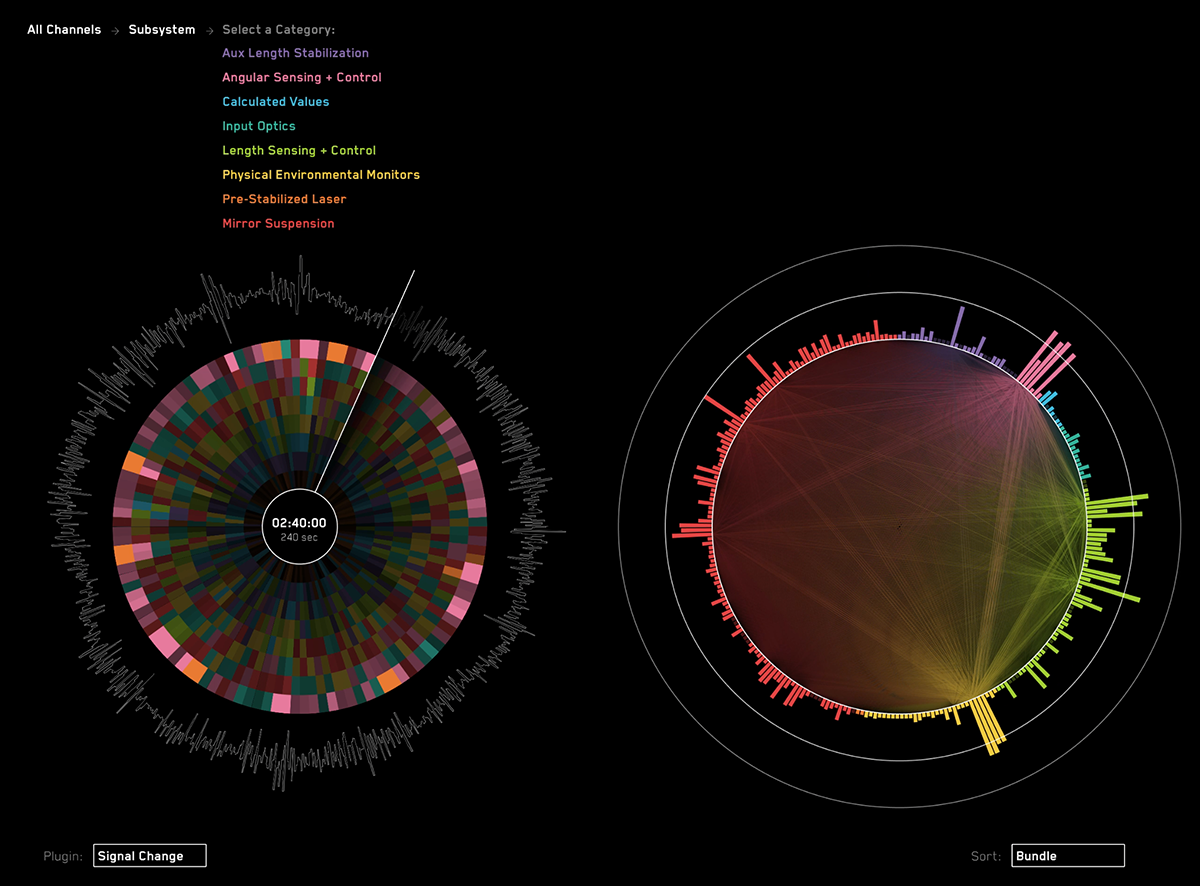
The Interferometer Watch application is a data visualization which displays the state of a laser interferometer (LIGO) machine. It was originally designed in the Summer of 2014 for the Data To Discovery: Summer of Visualization program at NASA's Jet Propulsion Lab and Caltech.
##Contributors:
This application was created by Luna Lie, Stephen Bader and William Lindmeier in conjuction with Dr. Rana Adhikari, Eric Quintero, Kari Hodge, and Nick Smith from the Caltech physics department.
##Dataset:
The application can read historical data from Frame Library formatted files. A sample dataset can be found here:
http://www.ligo.caltech.edu/~rana/ExampleData/. See the "Configuration" instructions below to use a dataset.
##Source Overview:
The Interferometer Watch app was developed on a Mac to run on a Mac, but in might work on a Windows machine with only slight modifications. Linux is not currently supported.
The primary app codebase is can be found in InterferometerWatch/
Some additional (required) files are found in Common/
The CommonData/ folder contains some sample channel bundling files, as well as a very small dataset. Take a look at the "Configuration" instructions to see how those are imported.
##Cinder:
The codebase requires the Cinder library. Cinder is a cross-platform framework that handles the OpenGL drawing, as well as many other things like math and library support (e.g. FFT).
This codebase was built using Cinder version 0.8.6dev. Before compiling the software, you have to update the build setting named CINDER_PATH with the path for your Cinder installation.
You can download it and learn more here:
http://libcinder.org/
##Configuration:
The app expects a file named "ligo_vis_config.csv" to live in the same directory as the app itself. This should be automatically copied in place when the app is built by XCode. This file is a simple key-value-pair CSV file with the following params (and sample values):
primary_channel_timeline_name, C1:LSC-DARM_OUT16
primary_channel_fft_name, C1:LSC-DARM_IN1_DQ
use_retina_display, 1
use_live_data, 1
live_data_server_address, 192.168.113.2
live_data_server_port, 8088
nds_version, 2
max_live_channels, 8
frame_files_path, /Users/bill/Documents/Jobs/JPL/DATA/Version_2_1232_sec
bundling_files_path, /Users/bill/Documents/Jobs/JPL/CODE/CommonData/Bundling
timeline_duration_sec, 240
live_data_time_delay, 120
use_fullscreen, 0
screen_width, 1280
screen_height, 800
Some of the params are contingent upon other values. For example, if use_live_data is 0, the server name and port won't be used.
Here are some brief explanations of the params:
primary_channel_timeline_name:
	This is the full name of the channel that will be drawn around the outside of the timeline (the circle on the left). The app was designed with the 16Hz DARM MON signal in mind.

primary_channel_fft_name:
	This is the full name of the high quality (DQ) channel that is used for the FFT signal. The app was designed with the DARM DQ in mind, which is the higher resolution version of the timeline signal.

use_retina_display:
	Set to 1 if the mac has a retina display (e.g. macbook pro) or 0 otherwise.

use_live_data:
	Set to 1 to connect to a NDS2 server for data, or 0 to use flat files in the FrameLibrary format.

live_data_server_address:
	The address of the NDS2 server for live data.

live_data_server_port:
	The port for the NDS2 server above.

nds_version:
	Use NDS version 1 or 2 when connecting to the live server

max_live_channels:
	This will cap the number of channels requested from the NDS2 server, for bandwidth considerations. Each channel request should take less time than it takes to parse them, so a high-bandwidth connection is preferred. Connecting to nds40 from the campus network maxed out at around 30 channels before it was too slow to keep up.

frame_files_path:
	The fully qualified path of the folder that you've got canned data in. These should be .gwf files (Frame Library) with the following naming scheme:

	C-R-1084700160-16.gwf

	The file names are cached when the app launches, so any new files added to the directory when the app is running, wont be picked up until the app is relaunched.

	This behavior can be changed in the "StoredDataConnection" class.

bundling_files_path:
	This is the fully qualified path for all of the channel and bundling .csv files. The following files must be in this directory:
		• channel_bundling_manifest.csv
		• channel_bundling.csv (this is the main channel sheet exported from the bundling spreadsheet)
		• filtering_manifest.csv

	as well as the bundling keys defined in the channel_bundling_manifest.csv. For example, Mirror Key.csv and Direction Key.csv.

timeline_duration_sec:
	The duration in seconds for historical data shown in the timeline. Data older than this will be purged.

live_data_time_delay:
	The number of seconds to subtract from the timestamps when requesting live data. The nds server may not have files for the most recent minute or so. This is basically a tape-delay.

use_fullscreen:
	1 for full-screen, 0 for fixed size (below).

screen_width:
	in pixels

screen_height:
	in pixels
##Network support:
As of this writing, I've only been able to connect to the nds40 server. However, because of the network speeds, the app caps out at around 60 channels. Otherwise it can't keep up in real-time because the data isn't coming in fast enough. In theory, if we're connected to a fast network server, this shouldn't be an issue.
The app opens 8 connections to the network server and each connection requests a subset of the channels in timed loops. Take a look at the LiveDataConnection and NDSDataStreamer classes for a more detailed look at how that's happening.
##Filters / Plugins:
The app was designed with extendability in mind. The interface calls them "Plugins" and the codebase may refer to them as "Filters". Basically, they analyze the incoming data and tell the front-end how to represent that data visually. Filters are passed timestamped channel data on their own thread in the processing pipeline, and are expected to create some kind of output for the data it's passed (e.g. FFT values). Those outputs will be stored for later. When the app is rendering, it will pass the filter these outputs (on the main thread) and ask for visual clues. For example, "Heres a packet of data. Based on these outputs, how long should the channel bar be?" or "How bright should the timeline bundle be?" The best way to start may be creating a very simple filter that stores fake data and returns sine wave values for the visual clues. That will give you a sense of what it's role in the app is.
###Creating a new Filter: To extend the app with a new filter, you need to add a new C++ class (which is the filter), and struct (which is the output). Look at ChannelFilterDiff or ChannelFilterFFT for an example. The new class must be a subclass of ChannelFilter and implement a number of virtual methods. The struct must be a sub-struct of FilterResults, and that can contain arbitrary data values that are relevant to the filter. However, it should also set the values in the super-struct.
###Adding a new Filter: Once the class has been written, a new line should be added to filtering_manifest.csv with the filter key (which is defined in the class file), a description, and whether it's enabled (1 or 0). You also need to edit DataParser::setupChannelFilters() to append a filter instance to mChannelFilters. See the comments for an example implementation.
##Bundling:
All channel names and bundle values are defined in a spreadsheet. Here's an example with the correct format:
https://docs.google.com/spreadsheets/d/1e5Wtcjn0PjHduuwqwmD9yyaPyL9_Zy9whjYOvufDoOA/edit#gid=0
The spreadsheet needs to be downloaded as a .csv file and named "channel_bundling.csv" into the path named “bundling_files_path” in the config file. There's also a file named "channel_bundling_manifest.csv" that lists which bundles in the spreadsheet should be used, what their column index is, and what the bundle "Value Keys file" is named.
Each enabled bundle must have a "Value Keys file", which also a .csv in the ”bundling_files_path”. This is just a lookup table between the bundle values (as defined in the spreadsheet), and a more human-readable name (e.g. LSC == Length Sensing and Control).
The app will only displayed the channels listed in that spreadsheet.
##User Interface:
Pausing the timeline: Space bar
Unpausing the timeline: Space bar
Quitting the app: Command+Q
Selecting a time in the Moment View (right circle): Drag the playhead with your mouse.
Selecting an FFT frequency: Drag / click your mouse in the FFT spectrum.
Fine-tuned FFT frequency selection: Up and Down arrow keys.
View a Channel Name: Hover your mouse over a bar in the moment view.
Selecting a Bundle / Category: Click on the bundle name
Going "back" in the navigation: Click on the nav node you want to return to (e.g. "All")
Picking a plugin: Click the current plugin name
Picking a sort mode: Click the current sort name
##Code structure:
The basic architecture of the app:
The data-processing happens in a multi-threaded pipeline.
- Injest:
Data is consumed by a DataConnection and added to the pipeline ( ProcessingPipeline ). The output of the DataConnection is called a DataPacket. - Process:
DataPackets that have been added to the pipeline from the connection are then handed off to DataParser. DataParser runs the latest data through any Filters that are active. The DataPacket is then wrapped up into a FilteredDataPacket and added back to the pipeline. FilteredDataPackets hold not only the raw data, but also the filter output and aggregate values. Roughly speaking filterResultsByChannel contains output for each channel for each filter. filterResultsByNavBundling contains aggregate output for each bundle category. These filtered packets are then added back into the pipeline. - Dispatch:
FilteredDataPackets that are waiting in the pipeline are picked up by dispatcher (FilteredDataServer) and stored for time-based lookup. This class is the ultimate data store for the data. Any data that's older than the duration of the timeline will be purged so it doesn't take up system memory.
The front-end UI queries the dispatcher for data using timestamps. Most of that logic happens in the main app class ( LIGOClockApp ). Specific submodules have their own rendering class. For example the timeline ( TimelineRenderer ), the moment view ( MomentRenderer ) and the bundling nav ( NavigationRenderer ).
More details of how the code works has been added as comments in the classes itself.