-
Since ROOT version 6.15/01 highlight mode for histogram or graph is successfully implemented.
- ROOT #1839 - highlight mode for histogram or graph objects (ROOT GitHub Pull request). Pull request successfully merged and closed.
- ROOT-6792 - Highlight mode for histogram or graph objects (ROOT JIRA issue)
-
https://root.cern.ch/doc/master/classTGraphPainter.html#GP08
Function SetHighlight() is implemented for TH1 and TGraph class.
This function switches on/off highlight mode, by default it is disabled.
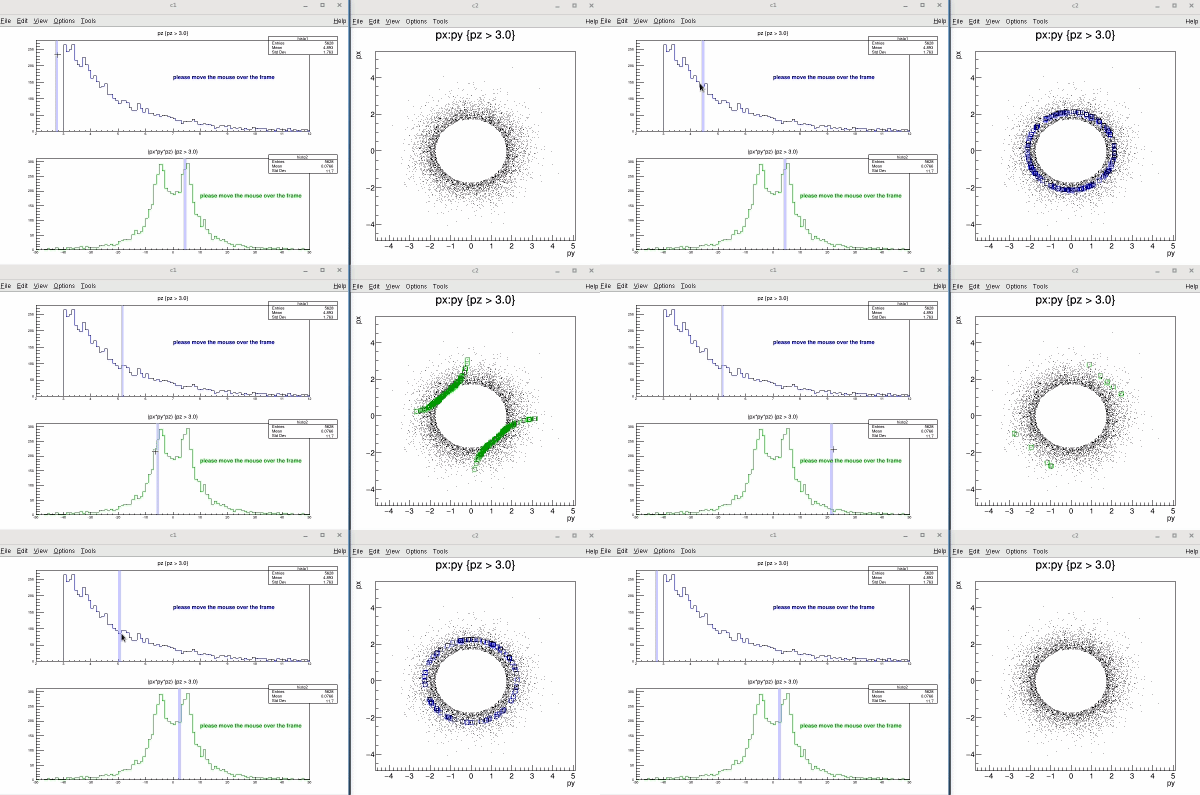
When Highlight mode is on, mouse movement over the bin (for histogram) or point (for graph)
will be represented graphically. In case of the histogram, color of the bin will change
(presented by box object) and in case of the graph, point will be highlighted as open circle
(presented by marker object). Moreover, any change of bin or point emits
signal TCanvas::Highlighted() which allows the user to react and call
their own function. For a better understanding please see
this demo video.
Highlight mode is switched on/off by function TH1::SetHighlight() for histogram
or TGraph::SetHighlight() for graph. TH1::IsHighlight()
(or TGraph::IsHighlight()) function to verify whether the highlight mode
enabled or disabled.
root [] .x $ROOTSYS/tutorials/hsimple.C
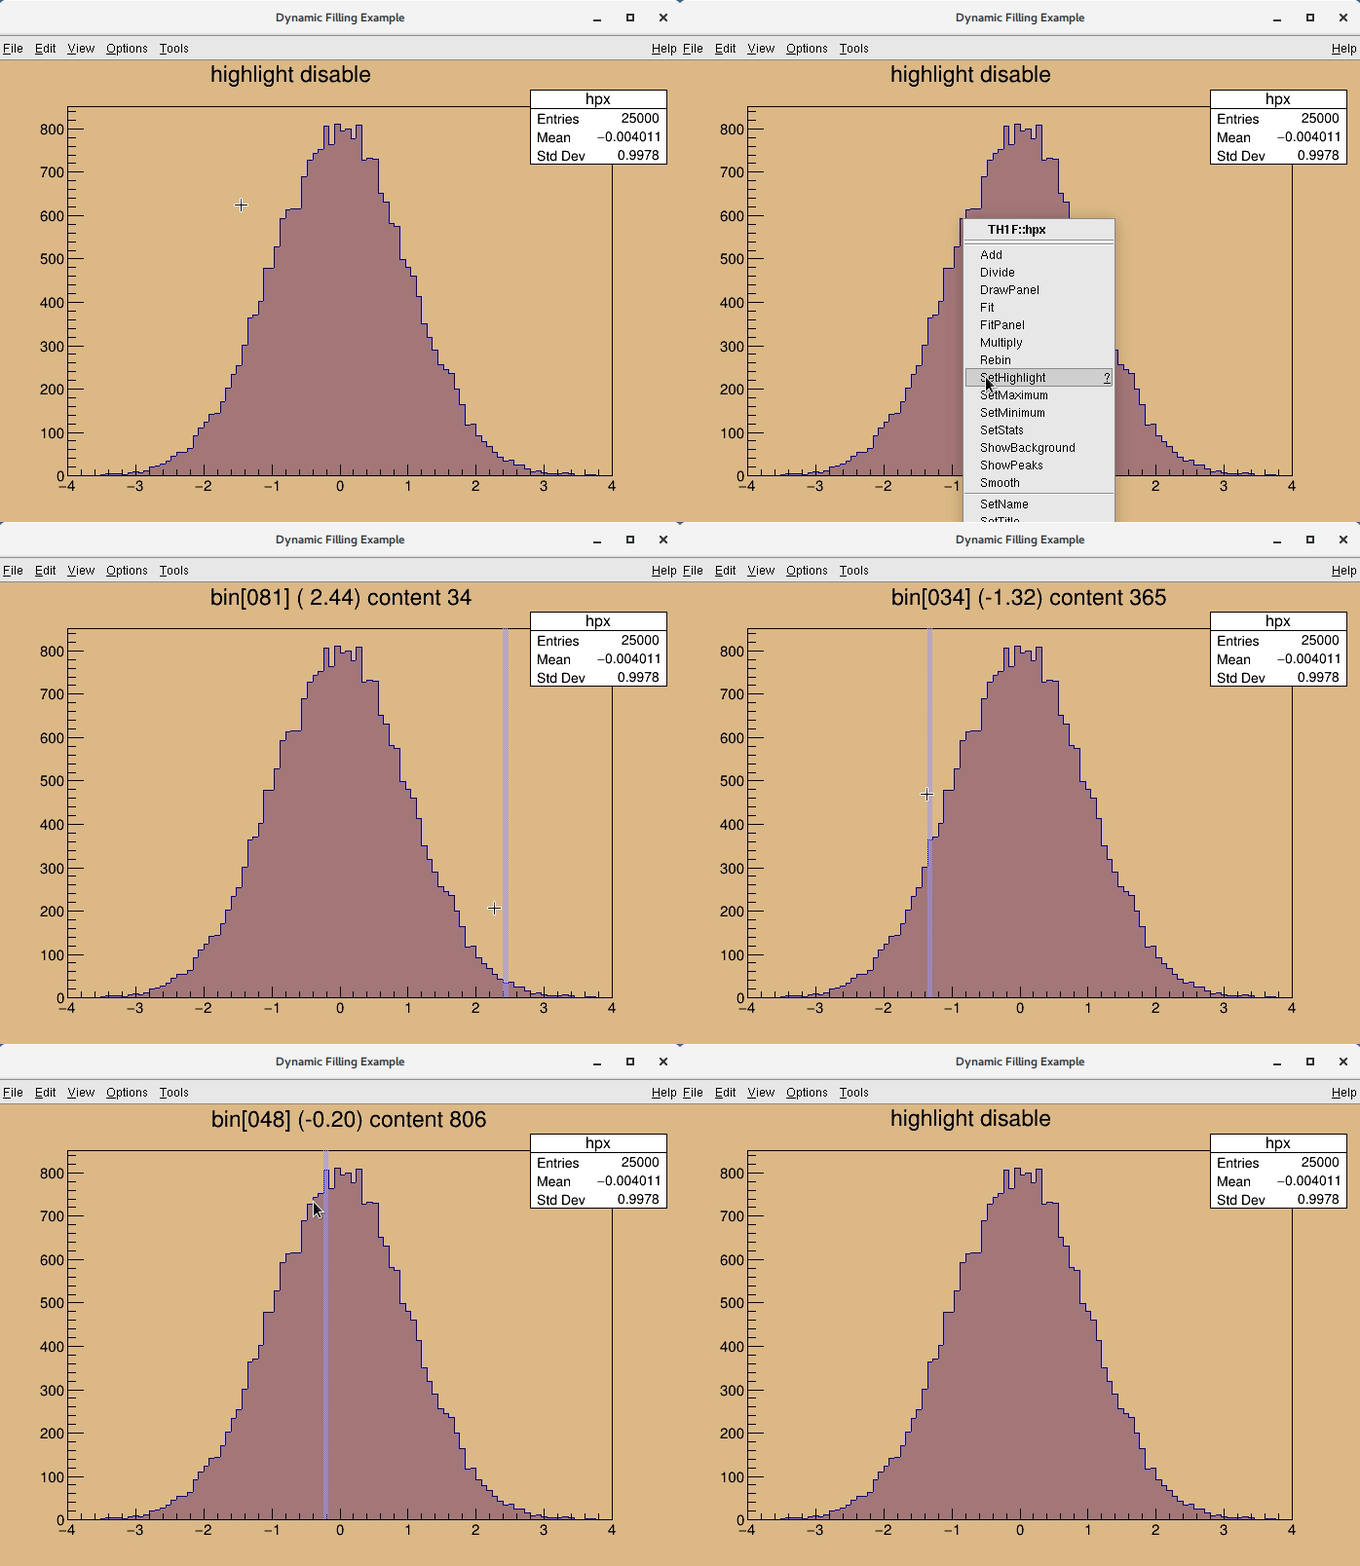
root [] hpx->SetHighlight(kTRUE)   // or interactively from TH1 context menu
The user can use (connect) TCanvas::Highlighted() signal, which is always emitted
if there is a change bin (or point) and call user function via signal and slot communication
mechanism. TCanvas::Highlighted() is equivalent TCanvas::Picked():
- when selected object (histogram/graph as a whole) is different from previous then emit
Picked()signal - when selected bin/point from histogram/graph is different from previous then emit
Highlighted()signal
Any user function has to be defined UserFunction(TVirtualPad *pad, TObject *obj, Int_t x, Int_t y)
(in example, see below, has name PrintInfo()). All parameters of user function are taken from
void TCanvas::Highlighted(TVirtualPad *pad, TObject *obj, Int_t x, Int_t y)
padis pointer to pad with highlighted histogram or graphobjis pointer to highlighted histogram or graphxis highlighted x bin for 1D histogram or highlighted x-th point for graphyis highlighted y bin for 2D histogram (for 1D histogram or graph not in use)
Make a connection from any TCanvas object to a user UserFunction() slot (signal and slot string
must have a form "(TVirtualPad*,TObject*,Int_t,Int_t)"):
TQObject::Connect("TCanvas", "Highlighted(TVirtualPad*,TObject*,Int_t,Int_t)",
                      0, 0, "UserFunction(TVirtualPad*,TObject*,Int_t,Int_t)");
or use non-static "simplified" function TCanvas::HighlightConnect(const char *slot):
c1->HighlightConnect("UserFunction(TVirtualPad*,TObject*,Int_t,Int_t)");
root [] .x $ROOTSYS/tutorials/hsimple.C
root [] hpx->SetHighlight(kTRUE)
root [] .x hlprint.C
file hlprint.C
#include <TCanvas.h>
#include <TH1.h>

void PrintInfo(TVirtualPad *pad, TObject *obj, Int_t x, Int_t y)
{
   TH1F *h = (TH1F *)obj;
   if (!h->IsHighlight()) // after highlight disabled
      h->SetTitle("highlight disable");
   else
      h->SetTitle(TString::Format("bin[%03d] (%5.2f) content %g", x,
                                  h->GetBinCenter(x), h->GetBinContent(x)));
   pad->Update();
}

void hlprint()
{
   if (!gPad) return;
   // TQObject::Connect("TCanvas", "Highlighted(TVirtualPad*,TObject*,Int_t,Int_t)",
   //                   0, 0, "PrintInfo(TVirtualPad*,TObject*,Int_t,Int_t)");
   // or simplified
   gPad->GetCanvas()->HighlightConnect("PrintInfo(TVirtualPad*,TObject*,Int_t,Int_t)");
}

